
This article provides an overview of the various Tagging reports available within Reveal.
Non-Audio Video Tutorial
Reveal provides you with several tagging reports that can be used to measure the performance of reviewers and provide statistics related to the document tagging/coding function.
Here is a list of available Tagging reports along with instructions on how to run them.
Accuracy Report
This report calculates the accuracy of the reviewers in applying tags. This is done by comparing tag work product to a specified example set and analyzing the document content of the examples against that of the documents tagged in the report scope.
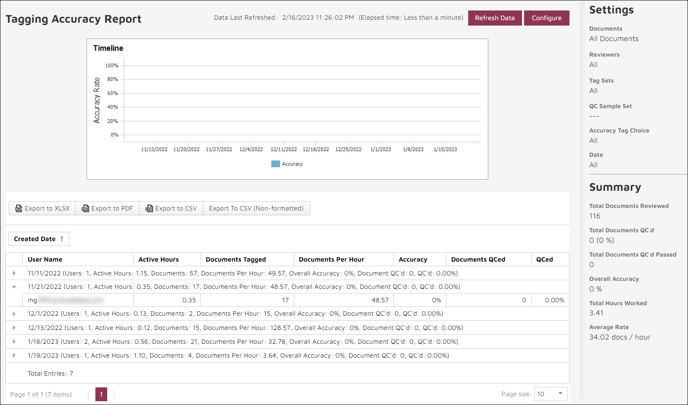
- The Timeline graph shows assessed review tagging accuracy percentage day by day.
- The Created Date table (with a date sort arrow in its title box) provides a summary for each day of the following:
- Number of Users
- Active Hours
- Documents Tagged
- Documents Per Hour
- Accuracy (percentage)
- Documents QCed
- QCed (percentage)
This table can be exported to Excel XLSX format, PDF, and CSV formatted or unformatted.
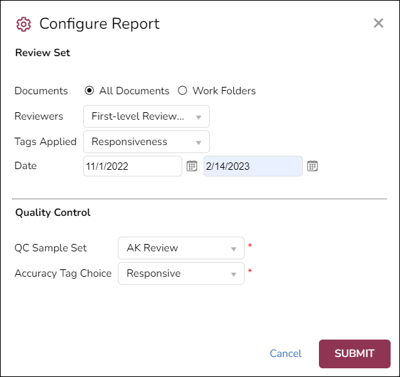
- Configure shows the options that have been set for this report.
-
- Review Set
-
-
- Documents - All Documents or click the [>] arrow to expand to select one or more Work Folders.
- Reviewers - Select the Team or Teams or individual reviewers to be evaluated.
- Tags Applied - The tags or tag choices to be evaluated.
- Date - Set start and end dates for reporting.
- Quality Control
- QC Sample Set - Specify a work folder containing a verified example of the tagging accuracy standard sought.
- Accuracy Tag Choice - Select the tag choice to use for comparison.
-
Click Submit to save the settings.
Summary shows work to date at a glance for the specified settings.
Breakdown
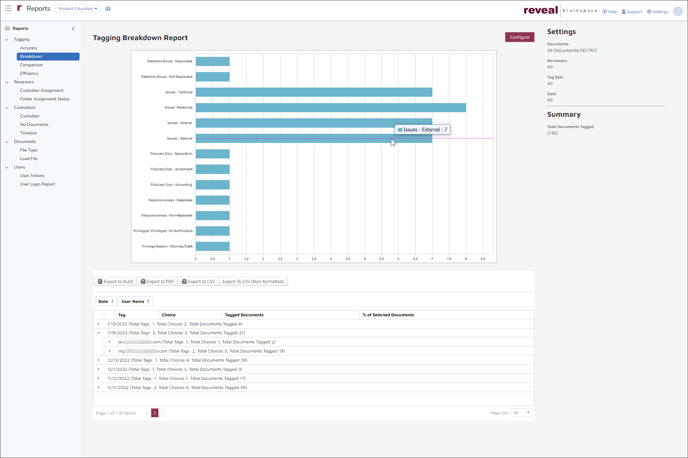
This graphical and statistical report provides a select overview of all tags by Tag Set and Reviewer. Configuration settings will be updated to the Settings pane at the right of the bar chart, and the results shown in the Summary pane below that.
-
- Tagging Breakdown Report – A bar graph showing the number of tags in the currently selected profile that have been set. Hovering over a bar opens bubble help providing the tag name and count.
- The table may be sorted by Date and secondarily by User Name in ascending or descending order. It sets out a summary for each day of Tag, Choice, Tagged Documents and % of Selected Documents. Clicking the arrow to the left of each date summary drops details per user for that day.
- This table can be exported to Excel XLSX format, PDF, and CSV formatted or unformatted.
- Settings accessed under Configure at the top of the screen are:
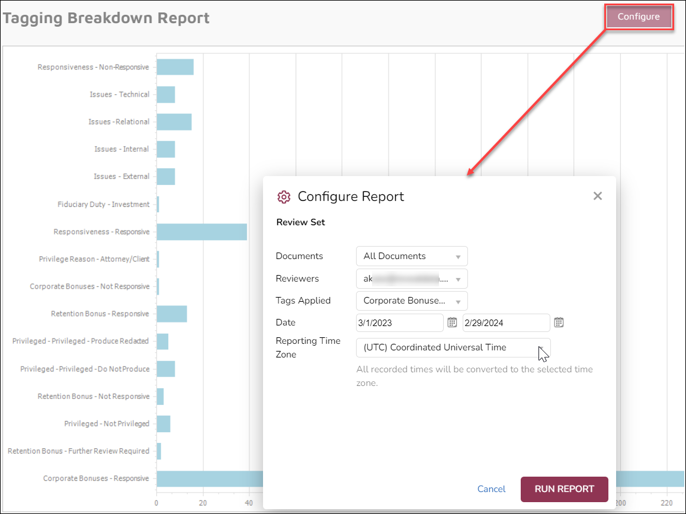
- Documents – All Documents or click the [>] arrow to expand to select one or more Work Folders.
- Reviewers – Select the Team or Teams or individual reviewers to be reported.
- Tags Applied – Select the tag profile, profiles, tags or tag choices for the report.
- Date – Enter the start and end of a date range to examine.
- Reporting Time Zone – As of Reveal 2024.3, specify the time zone to be used for the report.
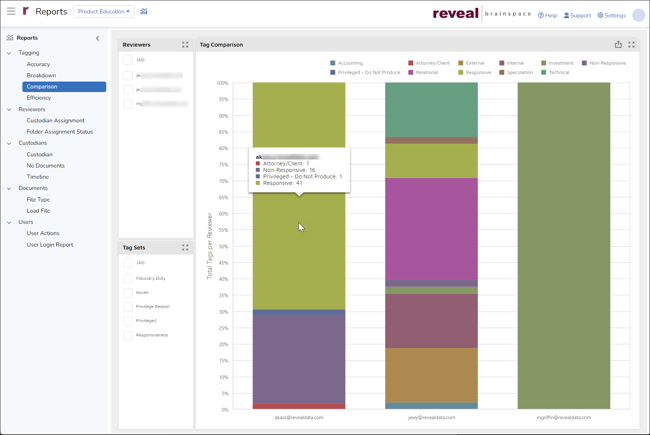
Comparison Report
This bar chart provides a visual overview of the tags by Reviewer by Tag Set. Reviewers selections may be quickly compared using the color-keyed bar chart; gliding the pointer over a Reviewer's bar provides detail numbers for each tag.
Efficiency
This report provides a breakdown of the efficiency of the document reviewers. It shows the total number of tags set by the Reviewer, then breaks this out against Active Minutes in Reveal to report Average Tags per Hour and Average Tags per Day. Hovering over a Documents Per Hour point in the graph pops up bubble help setting out the Date, Total Docs Tagged, and Documents Per Hour. The table below breaks out each work date by user. 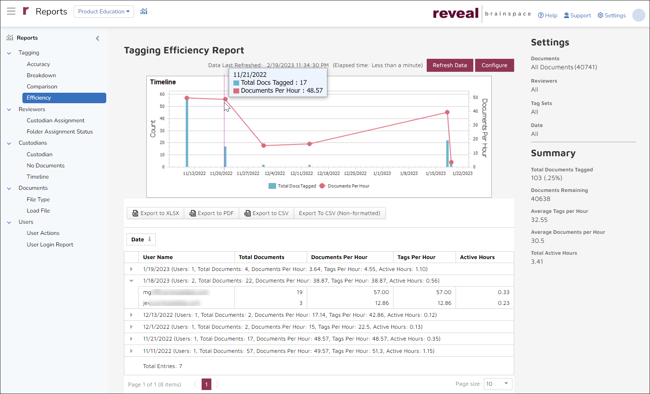
Configure settings for
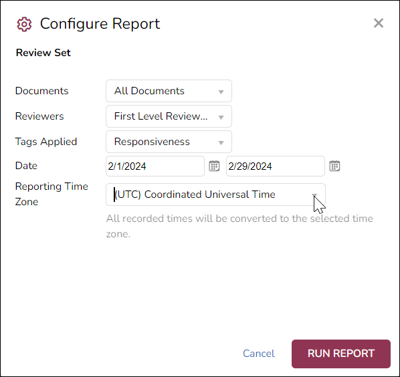
- Documents – All Documents or click the [>] arrow to expand to select one or more Work Folders.
- Reviewers - Select the Team or Teams or individual reviewers to be reported.
- Tags Applied – Select the tag profile, profiles, tags or tag choices for the report.
- Date – Enter the start and end of a date range to examine.
- Reporting Time Zone – As of Reveal 2024.3, specify the time zone to be used for the report.
Note: This report does not use login and logout time to calculate the active hours a user spends in the system. Instead, it uses a five-minute rolling window of user activity. For every action a user performs like tagging, document views, etc., the system will consider the user user active for a period of five minutes after the specific action is performed. Since most users do not log out of the system, Reveal uses this window of activity to determine their usage and efficiency. When calculating tags per hour, Reveal uses the number of tags applied during the window of activity. Finally, the system uses this window of activity to also calculate unique documents tagged per hour and total documents.
Last Updated 3/28/2024