
Data visualization of the correspondence between two types of metadata values.
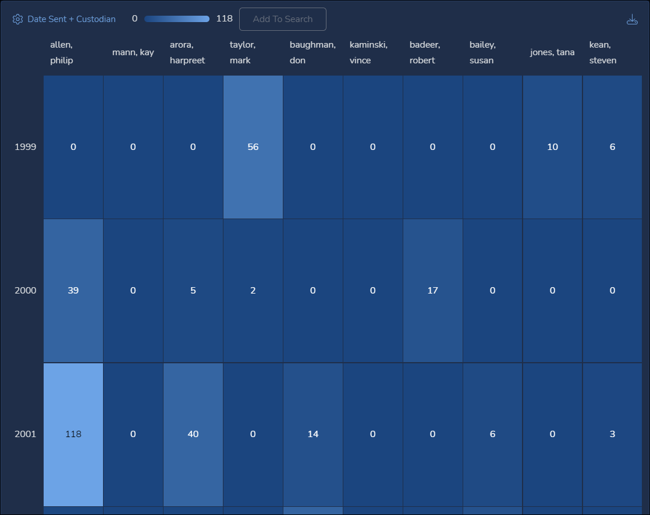
The Heatmap accessed under the Dashboard displays the co-occurrence of top or selected terms of one type of data (or search list) with another type of data. By default, the top terms of one type of metadata (that is, those returning the highest counts) with the top values of a second type of metadata. With color emphasis indicating “heat” or preponderance of intersections within the grid, users can see at a glance the strength of relationships between one type of data and another.
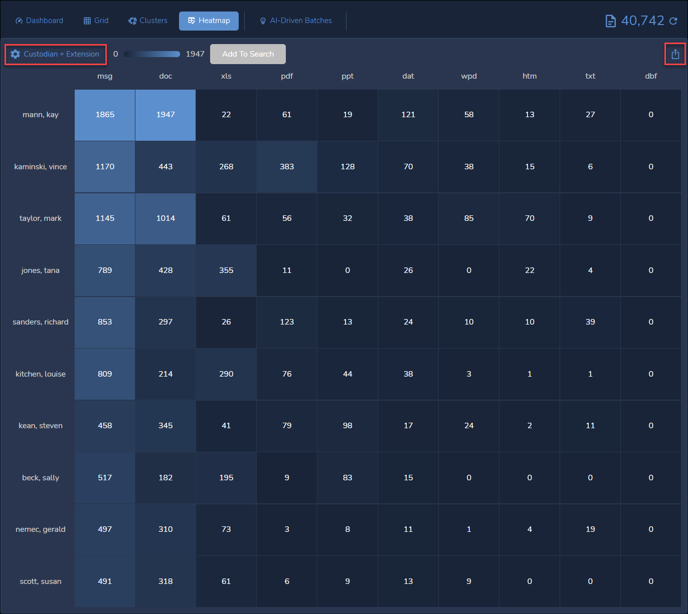
The above Heatmap is configured with Custodian metadata for rows and Extension metadata for columns, as confirmed by the Options button labeled Custodian + Extension in the upper left. Gliding a pointer over any box will display its meaning, for example 1170 hits for “msg” and “kaminski, vince”. There is also a button in the upper right to Export to CSV, which will export the labels and values of the Heatmap table.
Cells in the grid may be selected to be added to a search. Clicking to select cells activates the Add to Search button.
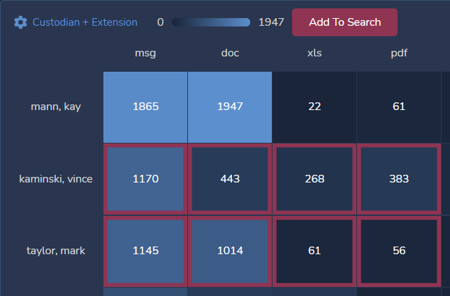
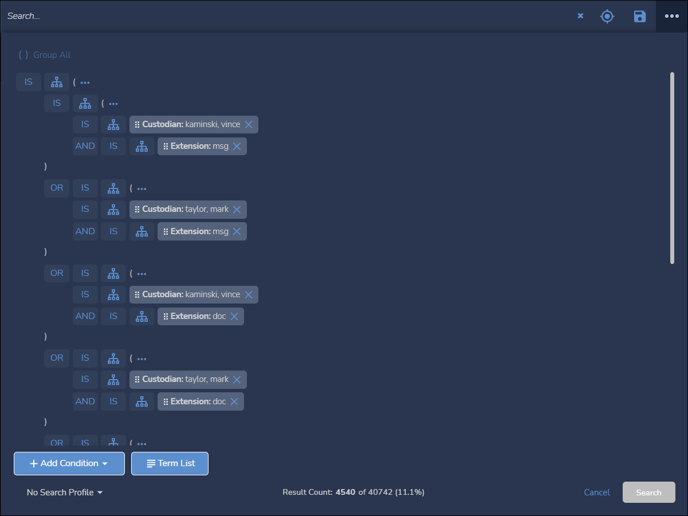
Selected items will be added to a search as an “Advanced” pill, which may be expanded to examine the search items.
The Options button allows the Heatmap to be configured to show the relationships most useful to the user, which may not necessarily be the default Custodian + Extension. The modal opens to the Rows tab, initially set to the Custodian field, with settings to change the Heatmap values.
Rows Settings
There is no practical limit to the number of rows that can be addressed in the Heatmap. Settings for the number of rows per page will split the retrieved set across as many pages as required. The number of rows per page determines how many row values may be sorted or exported at the same time, since these actions will not address all rows in the Heatmap for performance reasons.
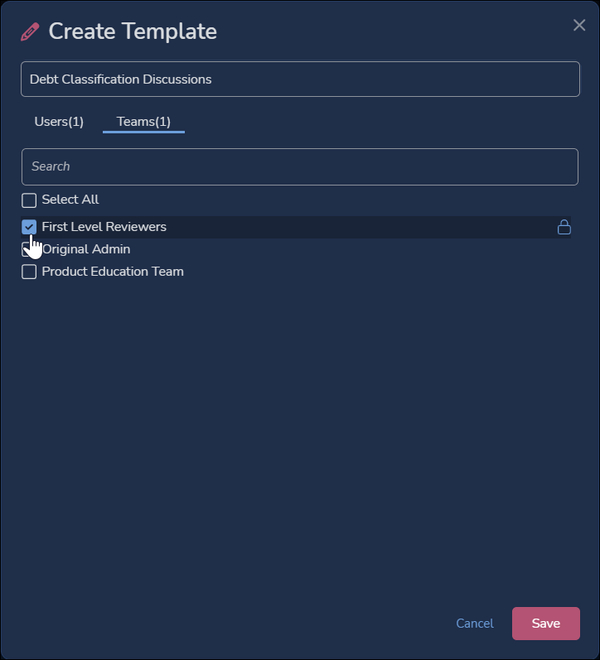
- Template – Given the number of options available for Heatmap visualization, the option to save, name and recall (or delete) a set of settings allows users to efficiently map and jump between a series of grids easily. You may pick a saved Heatmap option template from the list, Save or Delete current settings, or click + to add save current settings. Templates may be shared with selected Users or Teams in ReadOnly (default) or Editable mode.
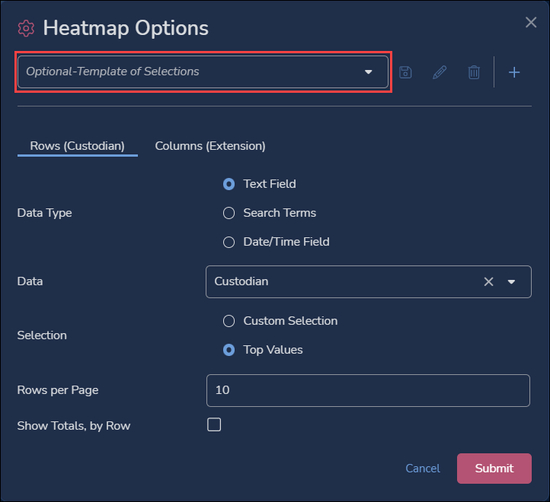
- Data Type
- Text Field is the default, to display values from the metadata field selected below.
- Data – For the Text Field Data Type, choose the field from the list of all those available in the currently selected Field Profile.
- Selection – Choose what will be displayed for the row labels:
- Custom Selection offers selection of specific values from the Data field, as well as Any Value or No Value. See the illustration under Columns.
- Top Values is the default, which will display the values with the highest number of records corresponding to the Columns values, up to the number set as maximum below.
- Maximum Number of Rows – Sets the depth of values to be displayed as rows for each page of the Heatmap. This will determine how many row values may be sorted (by clicking on a column heading, once for ascending, twice for descending) or exported at once. Higher maximums may significantly slow performance.
- Show Totals, by Row – Option to total across the row for the Columns values.
- Search Terms opens a Term List dialog, where RQL or keyword search terms may be entered, one per line,
- in a text list,...
-4.png?quality=high&width=550&height=760&name=131%20-%2003c%20-%20Heatmap%20options%20-%20Rows%20(Search%20Term%20with%20Sort)-4.png)
- ... or added in a table. In either case, the results may be sorted by term order (the order in which the terms were listed) or by result count, using a toggle at the bottom of the screen. Search retrieval will address up to 1,000 terms (1000 rows as paginated according to the Rows per Page setting) as of Reveal 11.8.
-Oct-06-2023-06-31-02-3160-PM.png?quality=high&width=550&height=663&name=131%20-%2003a%20-%20Heatmap%20options%20-%20Rows%20(Search%20Terms)-Oct-06-2023-06-31-02-3160-PM.png)
-
Search terms are validated as each line is entered, alerting you of issues with the syntax of that entered term.
-4.png?quality=high&width=550&height=688&name=131%20-%2003d%20-%20Heatmap%20options%20-%20Rows%20(Search%20Term%20Validation)-4.png)
- The search terms will be applied to the values selected for the Columns.
.png?quality=high&width=550&height=431&name=131%20-%2003b%20-%20Heatmap%20options%20-%20Rows%20(Search%20Term%20Heatmap).png)
- in a text list,...
- Date/Time Field adds the following specifications to analyze selected chronological metadata in the Heatmap. Here you specify the following new values:
-1.png?quality=high&width=622&height=531&name=131%20-%2003e%20-%20Heatmap%20options%20-%20Rows%20(DateTime%20Field)-1.png)
- Field – Select a date, time or date/time metadata field.
- Time Interval – Like the Timeline visualization, the default of Auto will offer the best fit for the volume and values selected. The other alternatives that may be specified (and reported using Export to CSV) are: Day, Week, Month, Quarter or Year.
Date time rows display in chronological order. A sample of date time values as specified above set against columns configured to display Custodian data would look something like this:
- Text Field is the default, to display values from the metadata field selected below.
Columns Settings
This is a simpler set of options to keep the Heatmap manageable and efficient.
-2.png?quality=high&width=550&height=784&name=131%20-%2004%20-%20Heatmap%20options%20-%20Columns%20(Custom%20Selection)-2.png)
- Data – Choose the field from the list of all those available in the currently selected Field Profile. (The Search Terms Data Type is not an option for Columns.)
- Selection – Choose what will be displayed for the row labels:
- Custom Selection expands the Columns Options to offer selection of specific values from the Data field, as well as Any Value or No Value. Selections are summarized in a box noting selections may include up to 38000 documents.
- Top Values is the default, which will display the values with the highest number of records corresponding to the Columns values, up to the number set as maximum below.
- Maximum Number of Columns – [Not shown in above illustration] Sets the depth of values to be displayed as columns. Higher maximums may significantly slow performance.
Last Updated 10/10/2023